Overview
We present a comprehensive segment-based analysis for the regional heritability of 497 traits in the UK biobank. We expect that the regional heritability information presented herein may help researchers for better understanding the unique genetic architectures of complex traits.
We spliced genome into small segments with various constant physical lengths (by chromosome, 128Mb, 64Mb, 32Mb, 16Mb, 8Mb). A requirement for this analysis was a method that estimates the regional heritability of a large number of segments accurately at a time. We found that the stratified LD score regression (LDSC) satisfied this property and used the method to conduct our analysis.
Using the data, we tried to answer the following questions.
Questions
To show the distribution of regional heritability over different scales, we plotted them using a nested donut plot. Since the estimated regional heritability from the segments is quite accurate, we could obtain a visually elegant figure as below for phenotypes of high level of polygenicity. Even though we did not supervise the method about the location or origin of the segments, the boundaries matched well across different scales of segmentation, implying that our estimates of regional heritability were robust.
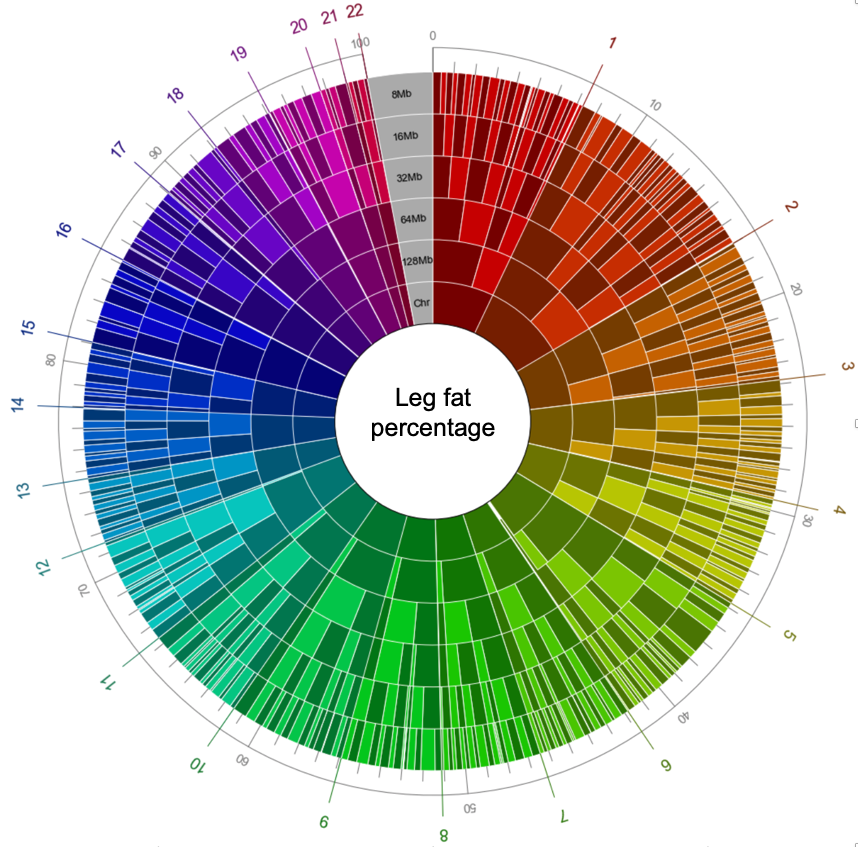
This figure shows the regional heritability of genomic segment split by various scales (chromosome, 128Mb, 64Mb, 32Mb, 16Mb, and 8Mb). The size of each segment is proportional to the fraction of heritability it accounts for. The fraction of heritability can be measured using outer circular gauge. The chromosome to which each segment belongs is marked by the background color of the segment.
For plots across all traits, please go to “By Phenotype”.
One key question to understanding polygenic architecture of traits can be how widely causal variants are spread across the genome, namely “the level of polygenicity”.
At each scale of segmentation, we wanted to systematically measure how evenly the heritability is distributed, the level of polygenicity. To this end, we calculated the heritability per physical length (%/Mb) for each segment and the variance of this quantity over all segments. Let \(V_t\) be this variance for trait t. Then, we define the level of polygenicity of a trait as: \[ \begin{align} ρ_t=-log(V_t) \end{align} \]
For each segment length, we calculated \(ρ_t\) for all 497 traits. To emphasize the relative difference of \(ρ_t\) among different traits, we define the scaled \(ρ_t\) as follows:
\[\begin{align}δ_t=(ρ_t-ρ_{min})/(ρ_{max}-ρ_{min})\end{align}\] where \(ρ_{min}\) is the minimum of \(ρ_t\) and \(ρ_{max}\) is the maximum of \(ρ_t\) among traits. Through our analysis, we used \(δ_t\).
To check the result, please go to “Level of polygenicity” or “By Phenotype”.
- Which groups of phenotypes do share genetic basis (“Phenotype Network”) Using the regional heritability, we investigated relationship among the traits included in our analysis.
For each pair of phenotypes included in our analysis, we calculated the correlation of regional heritability across the entire genome, which can serve as a proxy for the magnitude of pleiotropy between traits (see Methods).
Note that this correlation differs from the typical SNP-based genetic correlation in that regional heritability does not distinguish positive and negative effects. However, if we consider a locus as pleiotropic when it affects multiple traits regardless of directions, the regional heritability correlation may reflect the concept of pleiotropy better (Frei, Oleksandr, et al.). We analyzed the relationship among traits using the obtained information about regional heritability from the finest scale segmentation (8Mb). Using the regional heritability correlation, we rendered a correlation network of traits.
To check the result, please go to “Phenotype Network”.
There has been recently a considerable interest in identifying particular variants with pleiotropic effects on different traits. We searched for specific pleiotropic loci that contribute significant non-zero heritability to various phenotypes. For each locus, we calculated the inflation ratio of the fraction of total heritability, which indicates how many times the locus explains larger amount of heritability than its expected value (\({1}\over{N\,of\,segments}\)).
To check the result, please go to “Browser by Region”.
When we plotted \(δ_t\) of all phenotypes and all segment sizes, it was clear that some phenotypes show largely varying \(δ_t\) across segment sizes. We wanted to examine if the level of polygenicity can differ depending on the segment size. We applied a statistical test to measure how unevenly the regional heritability is distributed over the segments.
In order to do this, we conducted the analysis of variance (ANOVA). We calculated the heritability per physical length (%/Mb) for each segment in the lowest scale (8Mb). Then for each of upper scales (16Mb, 32Mb, 64Mb, 128Mb, and chromosomes), we grouped the segments based on the upper scale and applied ANOVA to calculate the statistical significance of between-group variance. If the heritability is unevenly distributed over segments in a specific upper scale, the p-value will become significant. Thus, the vector of p-values can give us a summary of the uniformity of heritability over different scales. Though many traits showed more significant p-values gradually on finer scale, each trait had different patterns with regard to at which scales the p-value rapidly became significant and how steeply the p-value became significant
To check the result, please go to “ANOVA result”.
Note
Our website provides our analysis results in a figure with which users can interact(magnify a region of interest, check detailed information, and download the figure, etc.) We aimed to convey our analysis result to other researchers in an accessible and intuitive manner. You can also download the raw data in “Download Center” menu.Video Tutorial
Citation
Data in this website is the result of the analysis conducted in the article.Kim, C. et al. Landscape of polygenicity of complex traits in UK Biobank. [under preparation].